

If a picture is worth a thousand words, then this chart from industry consultant Andrew Tsang might be worth a million.
America’s healthcare system is “An Abominable Creature.” That’s also the title of Tsang’s stellar blog post that meticulously maps out every dollar that flows through it.
- The flows in the diagram represent $4.9T, but they’re also a glimpse at every medical decision that was made in the U.S. last year. Every diagnosis. Every birth. Every death.
The charts don’t just map spending, they map our decisions. We built the healthcare system brick by brick with the choices we made, and although they might have all made sense individually, the end result is a monster of our own design.
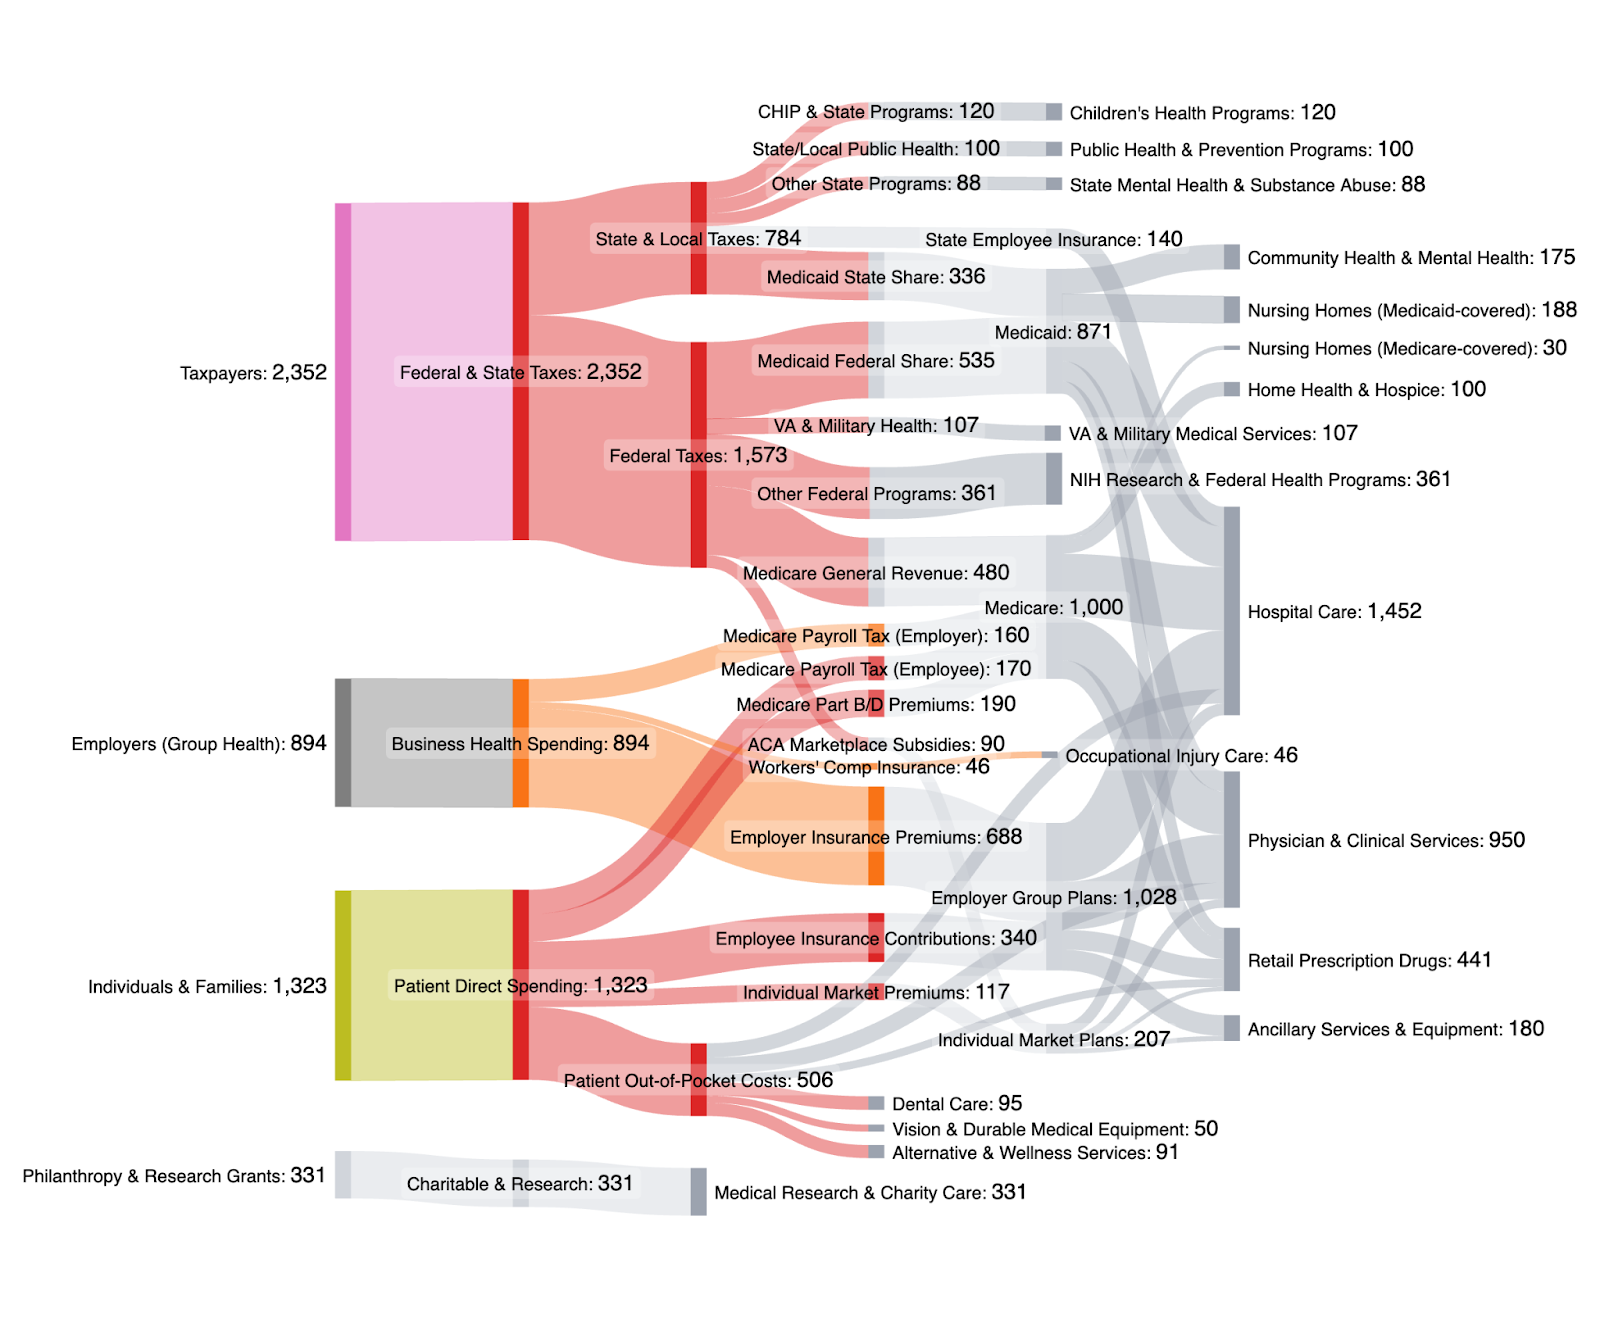
Decision 1 – Workers fund healthcare twice… or more [Chart 1].
- Federal, State, and Local Taxes – $2.4T for Medicare, Medicaid, and public health.
- Payroll Taxes – employers fund Medicare even though most employees aren’t 65.
- Premiums – $688B gets deducted from paychecks for employer plans.
- Out-of-Pocket Costs – Americans shell out another $506B when they actually get care.
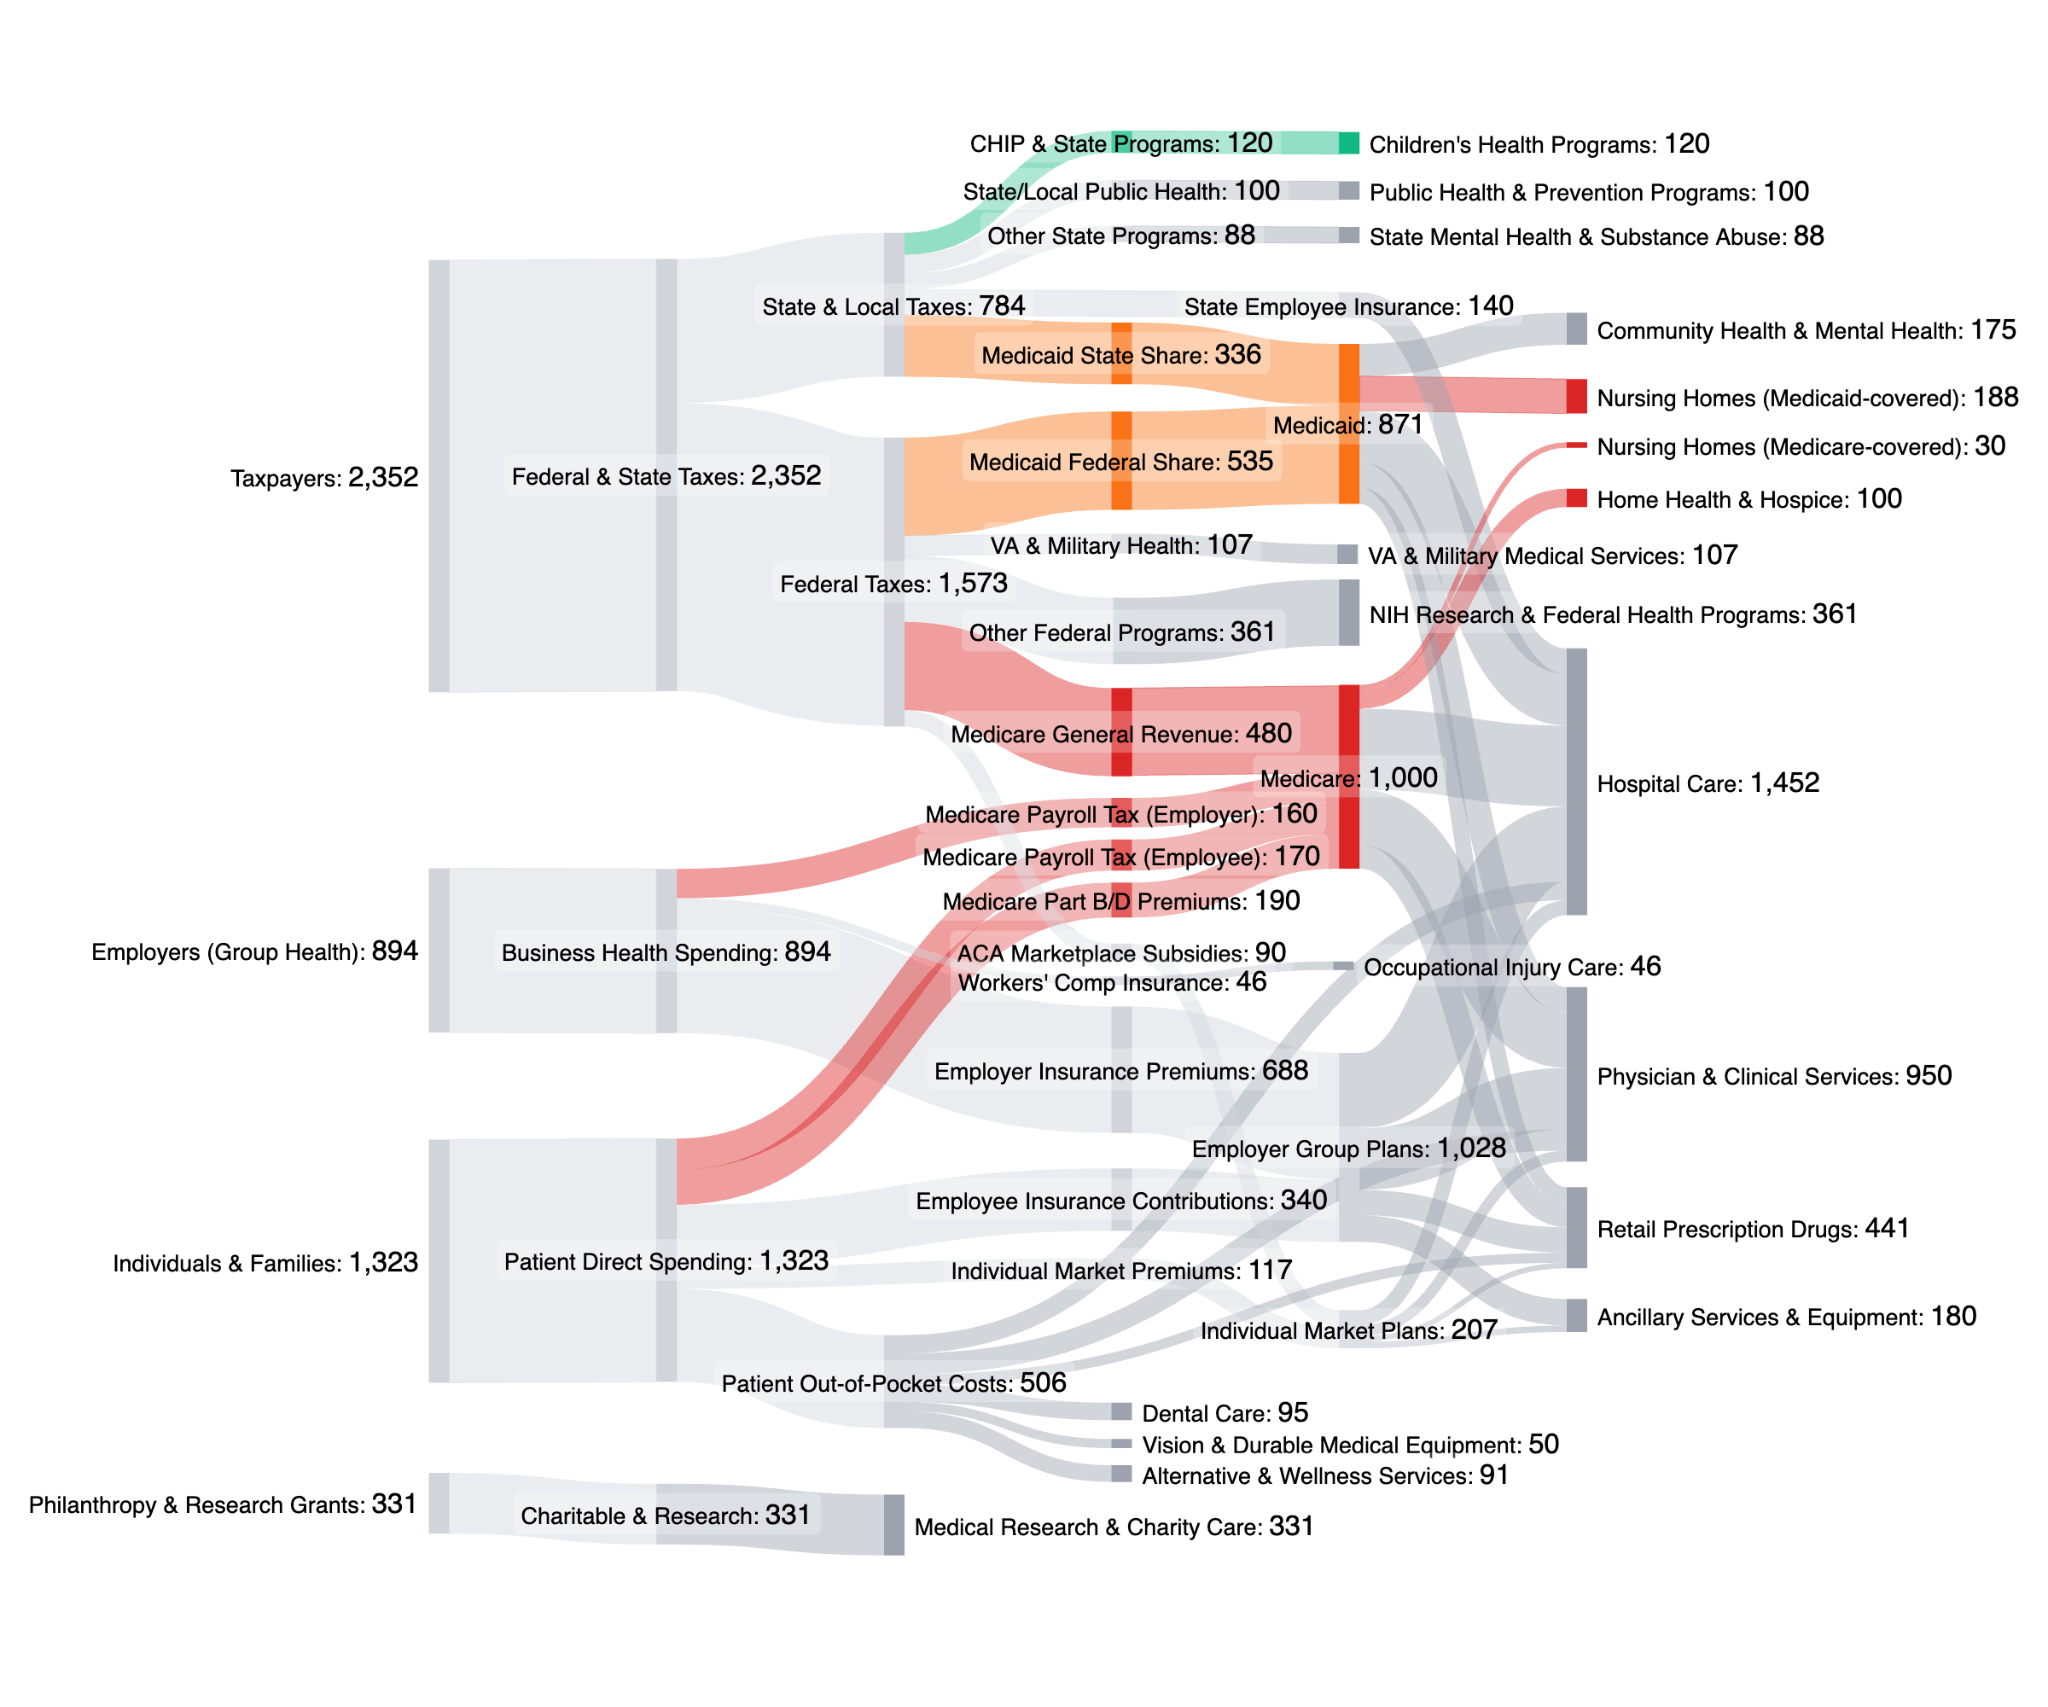
Decision 2 – We look after our seniors [Chart 2].
- Medicare accounts for $1T every year.
- Nursing homes account for $218B every year.
- Home health & hospice account for $100B (and 22% of all Medicaid spending).
Other Decisions – The full U.S. diagram can tell whatever story you want it to [Chart 3].
- Treatment is more important than prevention – $100B goes to public health while $1.5T goes to hospital care annually.
- Innovation is a bigger priority than price controls – $441B is spent on prescription drugs.
- Repairing old age is better than investing in children – $120B goes to children’s health compared to $1T for Medicare.
The Takeaway
The U.S. healthcare system was pieced together through a long chain of isolated decisions, each one solving a specific problem at the time. Tsang just gave us a beautiful illustration of the end result: a kraken with countless tentacles that all seem to have a mind of their own.


